A minimum of 34% of annual lottery sales revenues must be distributed to public schools, colleges, and universities. Public schools also receive unclaimed prize money, interest income or any administrative savings left over at the end of the sales year.
The money is to supplement, not supplant, regular support for public education. It must be used "exclusively for the education of pupils and students and no funds shall be spent for acquisition of real property, construction of facilities, financing of research or any other non-instructional purpose."
In March 2000 voters narrowly approved Proposition 20. It modifies the lottery law by requiring that half of any growth in lottery money above the 1997-98 base be spent on instructional materials or textbooks.
Results
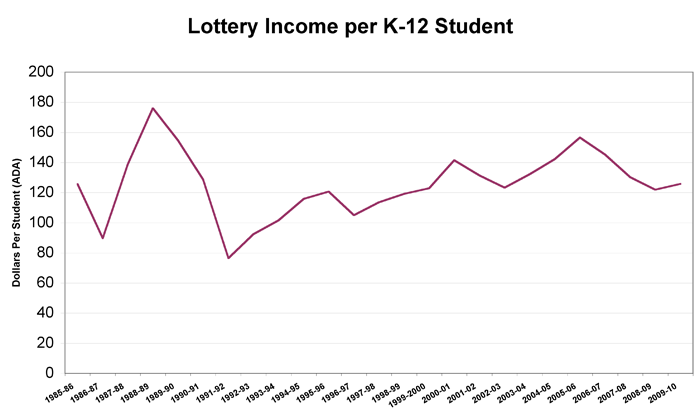
Lottery revenues represent only a small portion of a school district's budget—usually less than 2%. In recent years, per student lottery dollars to schools have hovered between $125-$145. Amounts generated by the California lottery tend to be unpredictable as they rise and fall with lottery sales. After a high in 2005-06, they gradually declined for three years but then increased slightly in 2009-10. While educators welcome additional funds, the lottery is not, as some believe, a significant source of funds for education.

Data: California Department of Education, School Fiscal Services Division, August 2010. Retrieved from CalEdFacts March 29, 2012. Note: Figures not adjusted for inflation.
K-12 Lottery Revenue Allocations
In amount per student based on average daily attendance (ADA)
| Year | Amount per student, unrestricted lottery revenues | Amount per student, instructional materials | Total Statewide K-12 Lottery Payments |
|---|---|---|---|
| 2009-10 | $110.37 | $15.51 | $838,936,043 |
| 2008-09 | $108.54 | $13.38 | $817,777,318 |
| 2007-08 | $113.79 | $16.47 | $876,559,341 |
| 2006-07 | $121.61 | $23.71 | $960,270,987 |
| 2005-06 | $127.20 | $29.35 | $1,039,970,015 |
| 2004-05 | $119.87 | $22.46 | $948,134,123 |
| 2003-04 | $114.79 | $17.44 | $872,987,663 |
| 2002-03 | $110.81 | $12.55 | $806,386,388 |
| 2001-02 | $116.13 | $15.24 | $853,747,149 |
| 2000-01 | $123.41 | $18.07 | $901,870,019 |
| 1999-00 | $115.45 | $7.53 | $769,408,464 |
| 1998-99 | $114.69 | $4.50 | $727,633,935 |
| 1997-98 | $113.67 | - | $675,117,674 |
| 1996-97 | $105.10 | - | $610,907,801 |
| 1995-96 | $120.71 | - | $691,363,263 |
| 1994-95 | $115.83 | - | $642,689,584 |
| 1993-94 | $101.63 | - | $556,290,312 |
| 1992-93 | $92.51 | - | $495,625,449 |
| 1991-92 | $76.55 | - | $400,869,886 |
| 1990-91 | $128.64 | - | $645,693,335 |
| 1989-90 | $154.47 | - | $783,026,959 |
| 1988-89 | $176.08 | - | $843,557,516 |
| 1987-88 | $138.78 | - | $647,361,315 |
| 1986-87 | $89.68 | - | $410,880,929 |
| 1985-86 | $125.67 | - | $555,457,022 |
Data: California Department of Education, School Fiscal Services Division, August 2010. Retrieved from CalEdFacts March 29, 2012. Note: Figures not adjusted for inflation.
Where to find the data On Ed-Data
You can find a district's lottery revenue on the Revenue Sources tab in the District Financial Reports.